Partnership
Support
Logo
  • Trading
    Accounts
    Account Types
    Markets
    Forex Trading Cryptocurrencies Stock Derivatives Turbo Stocks Commodities Equity Indices Precious Metals Energies Shares Thematic Indices
    Platforms
    MT5 Platform
    Our Offerings
    Flexy Copy Trading Execution Policy Margin and Leverage
  • Discover
    Education
    Learning Centre Live Education Blogs
    Community
    News and Analysis Analytical Tools Economic Calendar Forex Calculators
  • Promotions
  • Company
    Who is Flexy Group? Licences Legal Documents CSR Contact Us
Logo
Menu
  • Trading
    • Accounts
    • Account Types
    • Markets
    • Forex Trading
    • Cryptocurrencies
    • Stock Derivatives
    • Turbo Stocks
    • Commodities
    • Equity Indices
    • Precious Metals
    • Energies
    • Shares
    • Thematic Indices
    • Platforms
    • MT5 Platform
    • Our Offerings
    • Flexy Copy Trading
    • Execution Policy
    • Margin and Leverage
  • Discover
    • Education
    • Learning Centre
    • Live Education
    • Blogs
    • Community
    • News and Analysis
    • Analytical Tools
    • Economic Calendar
    • Forex Calculators
  • Promotions
  • Company
    • Who is Flexy Group?
    • Licences
    • Legal Documents
    • CSR
    • Contact Us
  • Partnership
Elliott Wave Theory Explained: What It Is & How to Use It in Forex Trading

Elliott Wave Theory Explained: What It Is & How to Use It in Forex Trading

By: Payel

Published on: Mar 08, 2025


Elliott Wave Theory is a popular technical analysis method used by traders to forecast market trends by analyzing recurring price patterns. Introduced by Ralph Nelson Elliott in the 1930s, this theory is based on the idea that market movements follow predictable cycles influenced by crowd psychology. Today, it remains a crucial tool for traders in forex, stocks, and cryptocurrency markets.


In this blog, we’ll explore the fundamentals of Elliott Wave Theory, how it works, and practical ways to apply it in trading.


What is Elliott Wave Theory?


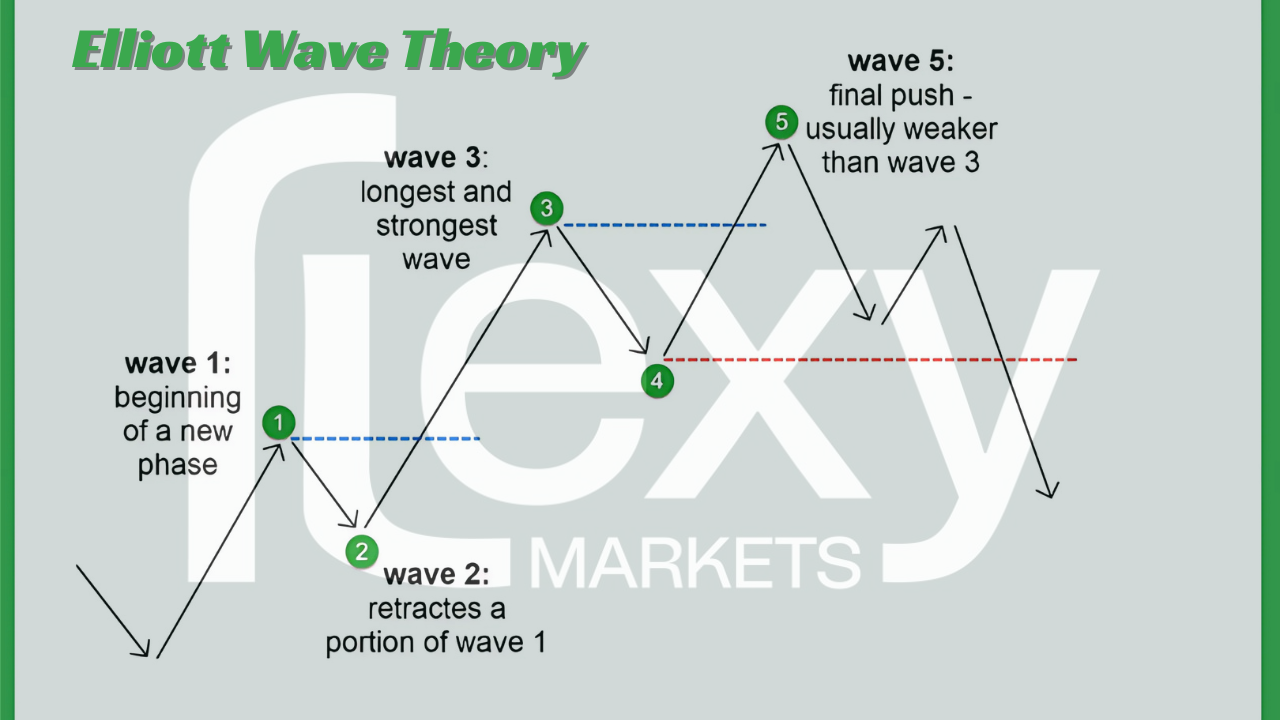
Elliott Wave Theory is based on the concept that financial markets move in repetitive cycles, driven by the collective behavior of traders. These cycles consist of five-wave patterns in the direction of the trend (impulse waves) followed by three-wave corrections (corrective waves).


The Two Main Wave Types:


Impulse Waves (5-Wave Pattern):


  • Moves in the direction of the primary trend.

  • Consists of five distinct waves (1, 2, 3, 4, 5).

  • Wave 3 is usually the strongest and longest.


Corrective Waves (3-Wave Pattern):


  • Moves against the primary trend.

  • Consists of three waves (A, B, C).

  • Corrective waves help reset the market before another impulse wave starts.


Understanding these patterns helps traders anticipate market trends and make better trading decisions.


How Elliott Wave Theory Works


Elliott Wave Theory follows a structured set of rules that traders use to analyze price movements. Here are the key rules:


  1. Wave 2 cannot retrace more than 100% of Wave 1.

  2. Wave 3 is never the shortest among Waves 1, 3, and 5.

  3. Wave 4 cannot overlap with the price area of Wave 1.


By identifying these patterns, traders can predict potential market reversals and plan their trades accordingly.


How to Use Elliott Wave Theory in Trading


  • Identify Market Trends


Elliott Wave Theory helps traders recognize the beginning and end of market trends. By identifying impulse and corrective waves, traders can enter trades at the right time and avoid unnecessary risks.


  • Use Fibonacci Ratios for Confirmation


Fibonacci retracement levels play a crucial role in Elliott Wave analysis. Common Fibonacci levels (38.2%, 50%, and 61.8%) help traders identify potential reversal points and entry zones.


  • Set Stop-Loss and Take-Profit Levels


By analyzing wave structures, traders can set stop-loss and take-profit levels strategically. For example, placing a stop-loss below Wave 2 ensures risk management if the market does not follow the expected pattern.


  • Combine with Other Indicators


For better accuracy, traders often combine Elliott Wave analysis with:


  • Moving Averages (to confirm trends)


  • RSI (Relative Strength Index) (to spot overbought or oversold conditions)


  • MACD (Moving Average Convergence Divergence) (to identify trend strength)


Apply in Different Timeframes


Elliott Wave Theory works on multiple timeframes, from intraday charts to long-term trends. Day traders can use it for short-term price movements, while long-term investors apply it to identify major market cycles.


Common Challenges of Elliott Wave Theory


Despite its effectiveness, Elliott Wave Theory has some challenges:


  • Complexity: Identifying waves correctly requires practice and experience.

  • Subjectivity: Different traders may interpret wave structures differently.

  • False Signals: Market conditions can sometimes lead to misleading wave patterns.


To overcome these challenges, traders should practice with historical data, use additional technical tools, and follow market news for better decision-making.


Conclusion


Elliott Wave Theory is a valuable tool for predicting market movements and improving trading strategies. By understanding impulse and corrective waves, traders can make informed decisions, manage risk effectively, and increase profitability. While it requires time and practice to master, combining Elliott Wave analysis with other technical indicators enhances its accuracy.


If you’re looking to enhance your trading skills, start practicing Elliott Wave analysis and integrate it into your trading plan today!

Comments

No comments yet. Be the first to comment!

Leave a Comment

Top News Articles

CoreWeave Soars 268% in 2025, Outperforming Nvidia and Dominating AI Growth

CoreWeave Soars 268% in 2025, Outperforming Nvidia and Dominating AI Growth

Published on: Jun 19, 2025

Stocks Slide as Mideast Escalation Risk Mounts: US Futures, Oil Prices and Geopolitical Concerns

Stocks Slide as Mideast Escalation Risk Mounts: US Futures, Oil Prices and Geopolitical Concerns

Published on: Jun 19, 2025

Pound Treads Water as Bank of England Holds Interest Rates

Pound Treads Water as Bank of England Holds Interest Rates

Published on: Jun 19, 2025

If You Have $1,000 to Invest, This Is the AI ETF to Buy

If You Have $1,000 to Invest, This Is the AI ETF to Buy

Published on: Jun 19, 2025

FTSE 100 Slips as Bank of England Holds Rates Amid Middle East Tensions

FTSE 100 Slips as Bank of England Holds Rates Amid Middle East Tensions

Published on: Jun 19, 2025

Is Iron Mountain (IRM) Stock Outperforming the Dow in 2025?

Is Iron Mountain (IRM) Stock Outperforming the Dow in 2025?

Published on: Jun 18, 2025

The Stock Market is Booming, So Why Are Investors So Scared?

The Stock Market is Booming, So Why Are Investors So Scared?

Published on: Jun 18, 2025

Tezos (XTZ) Price Prediction 2025–2050: Can XTZ Rebound?

Tezos (XTZ) Price Prediction 2025–2050: Can XTZ Rebound?

Published on: Jun 18, 2025